Introduction
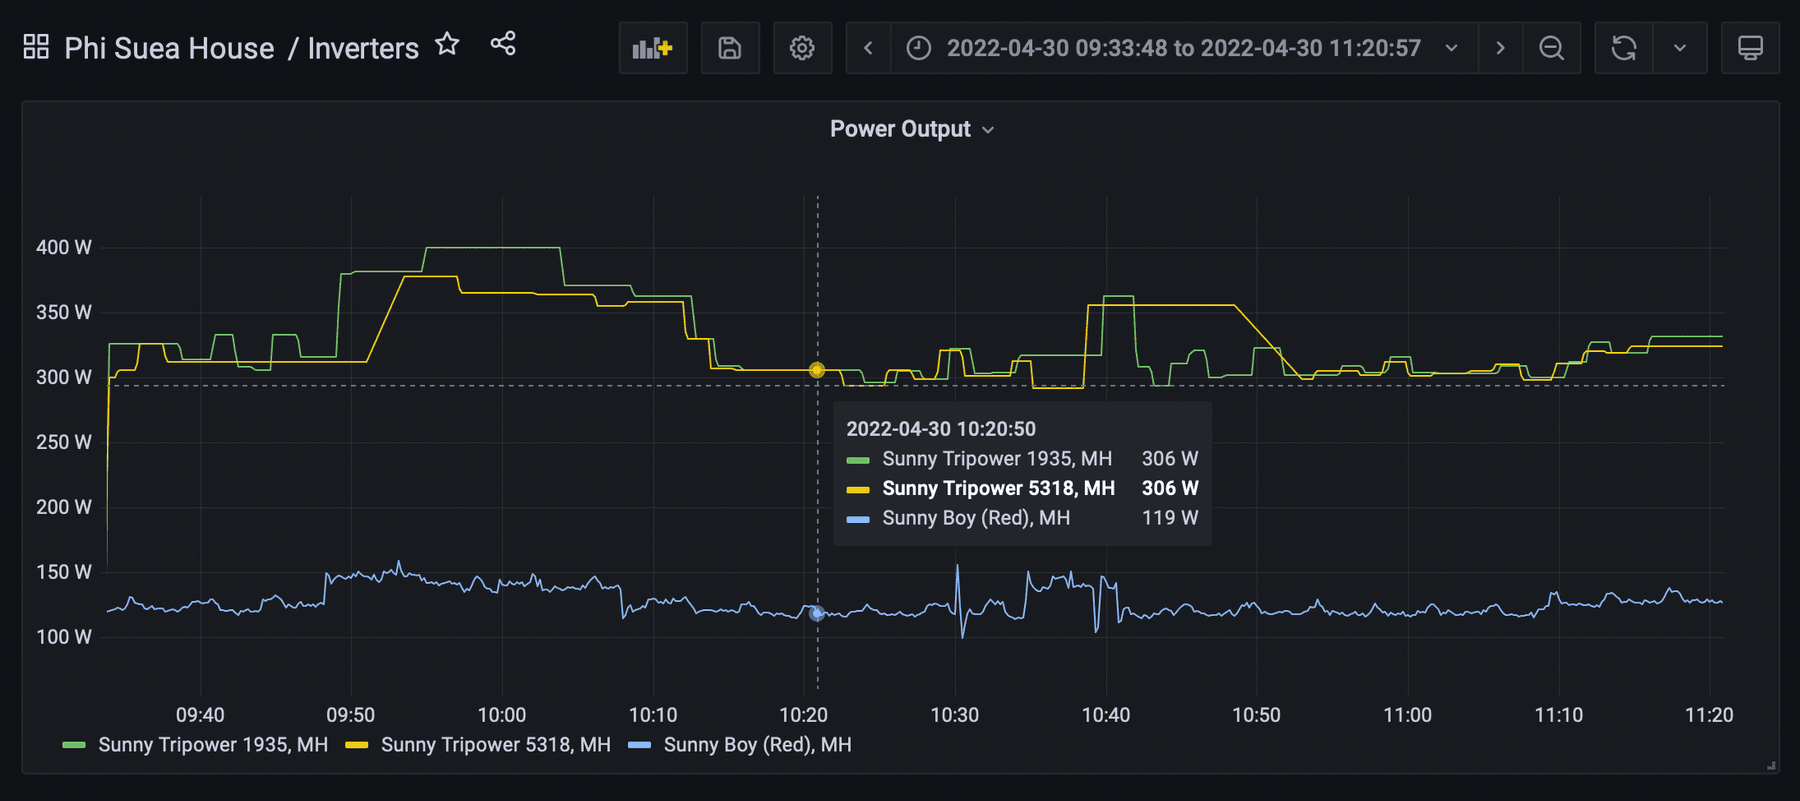
Enapter Cloud uses Enapter Blueprints to automatically generate telemetry visualisation dashboards for you to analyze the data from your devices. These dashboards work fine for most use cases, but if you need a more tailored solution, we provide custom dashboards.

Here are some features of custom dashboards:
- Multiple device metrics on a single panel. Combine the telemetry of any number of different devices (e.g. Electrolyser and Solar Inverter) and analyze the correlation.
- Device commands. Interact with your devices right from the dashboard and see the changes in real time.
- Adjustable look of visualisation panels. Let Enapter Cloud persist your modifications so that you can access them later on.
- Integration with Grafana. If you already use (or would like to use) Grafana as your monitoring solution, install the Enapter API datasource plugin and query the device telemetry stored in Enapter Cloud.
Setup
Two methods exist for setting up custom dashboards:
- Enapter Cloud Hosted (Recommended)
- Self Hosted
The easiest way to discover and use custom dashboards is with Enapter Cloud, which offers hosted durable high-performance Grafana instance with Enapter plugins pre-installed.
To use Enapter Cloud hosted solution:
- Create an account in Enapter Cloud.
- Contact us at developers@enapter.com to get access to the dashboards page.
If you want to run custom dashboards locally on your own hardware though, you can download the Enapter Grafana Plugins and install them to your own Grafana instance.
To host custom dashboards on your hardware:
- Create an account in Enapter Cloud.
- Issue an Enapter API Token.
- Install and configure Enapter Grafana plugins.
💬 Need Help?
Have a question or hit a roadblock? Join the Enapter Discord community to get quick support, exchange ideas, and collaborate with other developers and energy experts.