Debugging Blueprint (Getting Logs from UCM)
- Web IDE
- CLI
The process of debugging your Blueprint using Web IDE is pretty simple. The idea is to get access to the real time logs of UCM and check which telemetry is sent and which errors are triggered in Lua. First of all navigate to Blueprints section in the Enapter Cloud and select your Blueprint from the list, if device is not selected automatically - select the device and click LOGS in the status bar in the bottom of the screen.
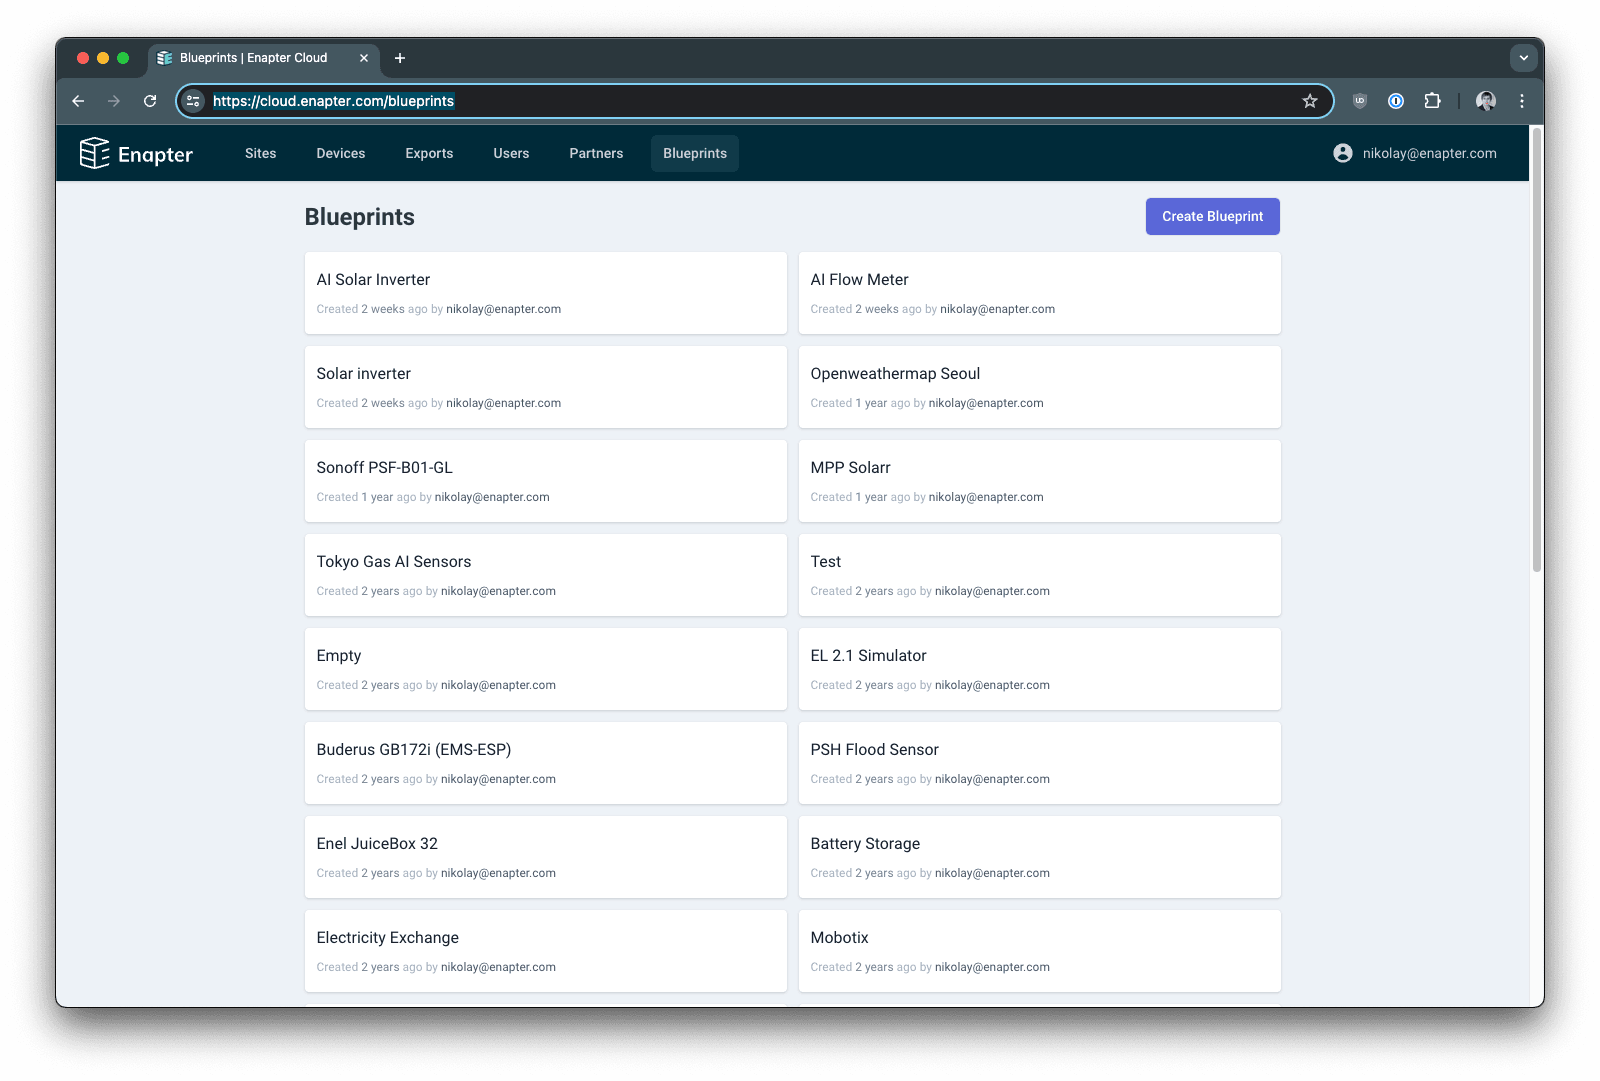
Select Blueprint from the list
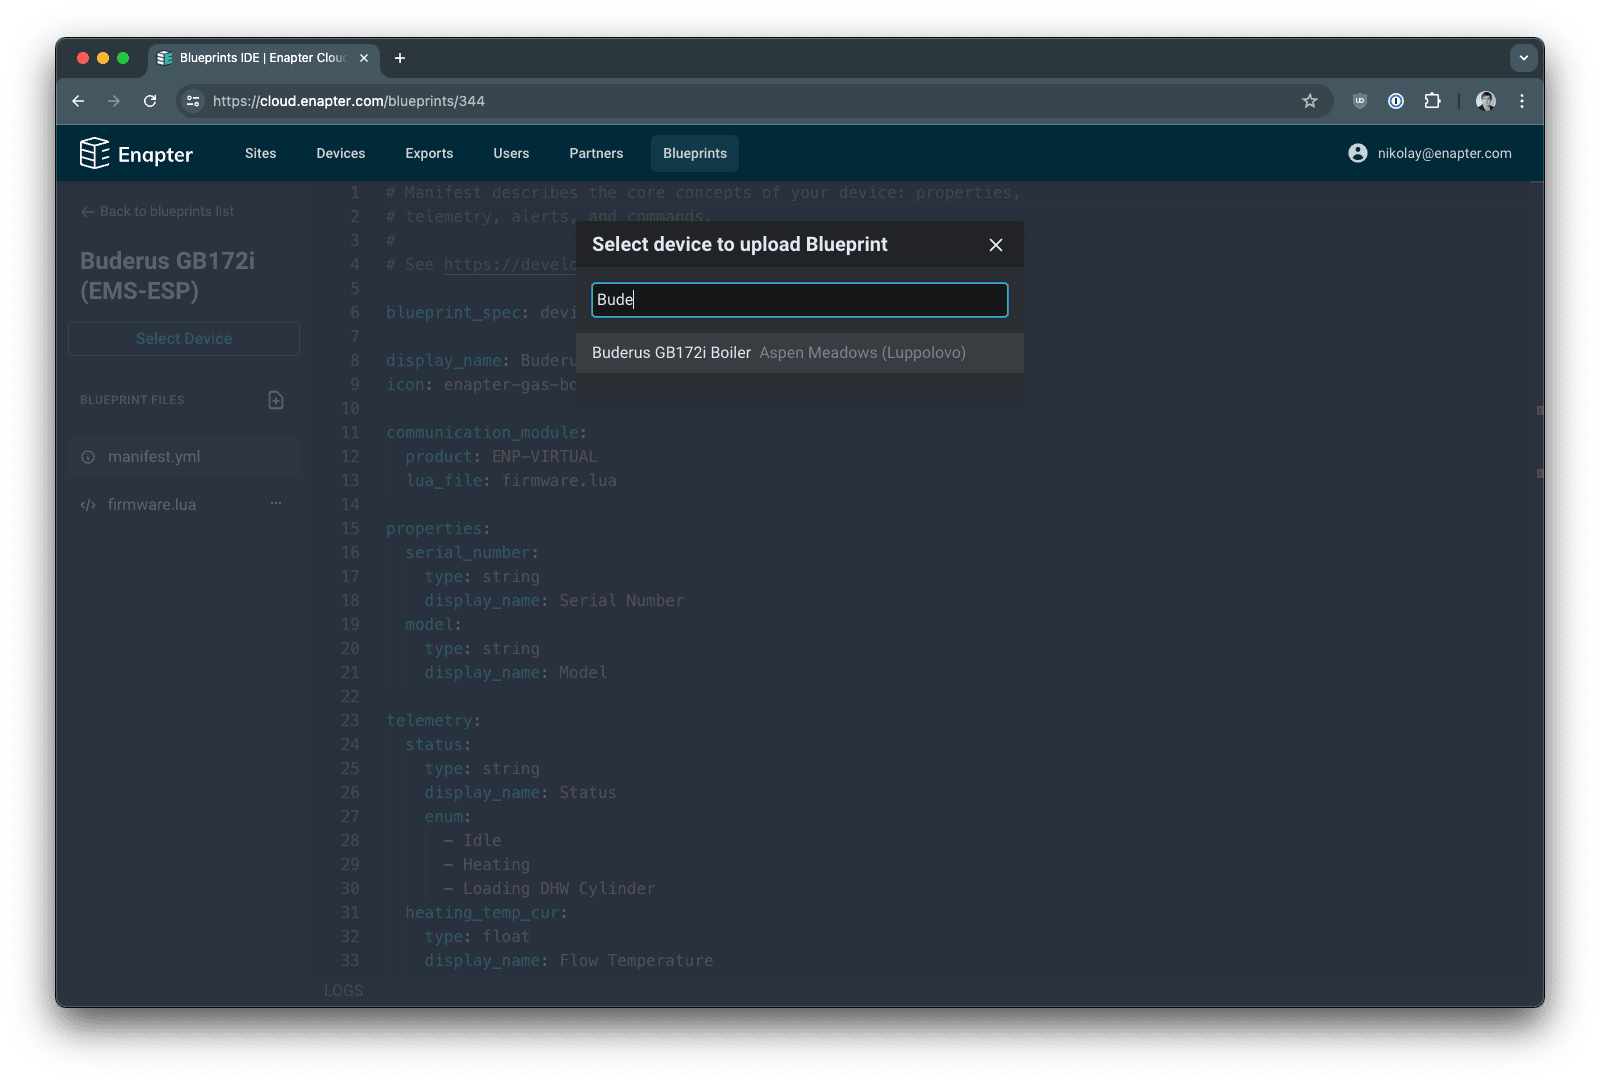
Click Select Device button and select your device from the list
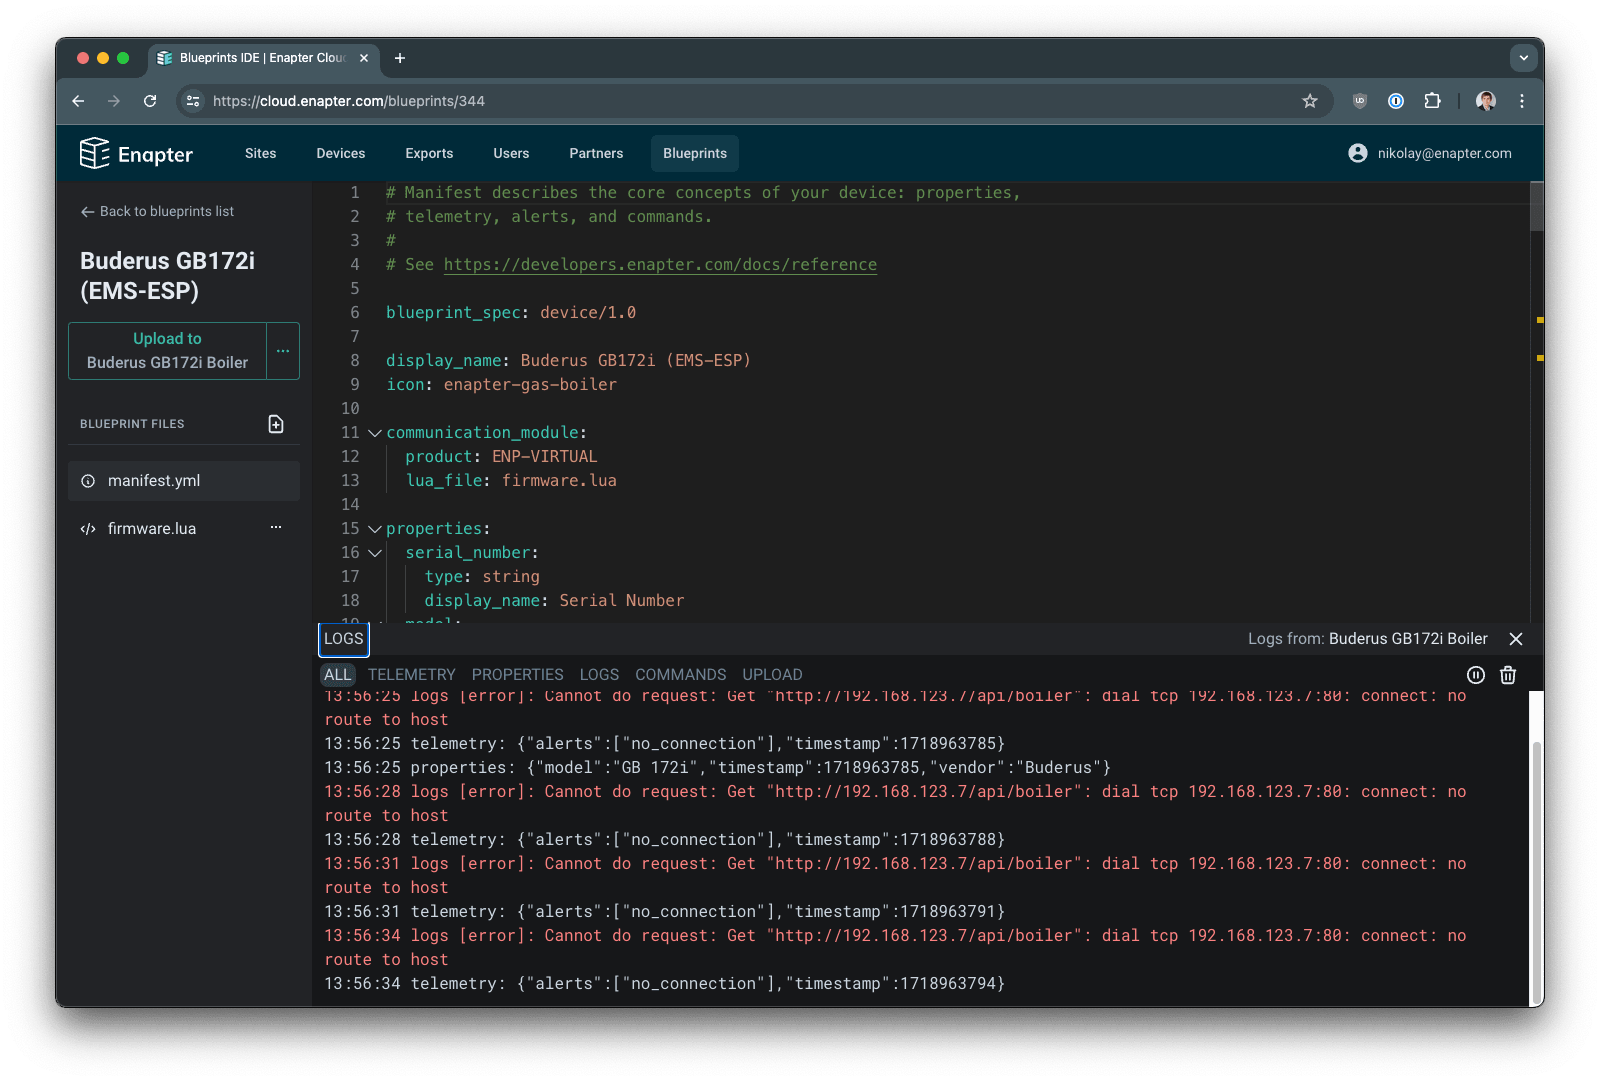
Select Blueprint from the list
Enapter CLI is convenient cross-platform tool for Mac OS X, Windows and Linux for management of Enapter services, including Blueprints. It is very handy when text editor or desktop IDE such as VS Studio Code are used to develop and upload Blueprints. Without Enapter CLI you would have to copy and paste your files into Web IDE.
The tool is provided as open-source software and available in both source code and binaries at GitHub. If you are lucky user of Mac OS, Enapter CLI can be installed with Homebrew which will help to ensure proper upgrade:
brew tap enapter/tap && brew install enapter
Otherwise install it from source or use official binaries.
Doesn't matter which OS you are using Enapter CLI requires access token for authentication. Getting a token is easy and can be done by following a few steps.
- Ensure you have registered Enapter Cloud account. If not, sign up here.
- Log in to your Enapter Cloud account, click on your profile name in top right corner and choose
Account Settings - Select
API Tokensmenu and clickNew Tokenbutton - Follow the instructions on the screen
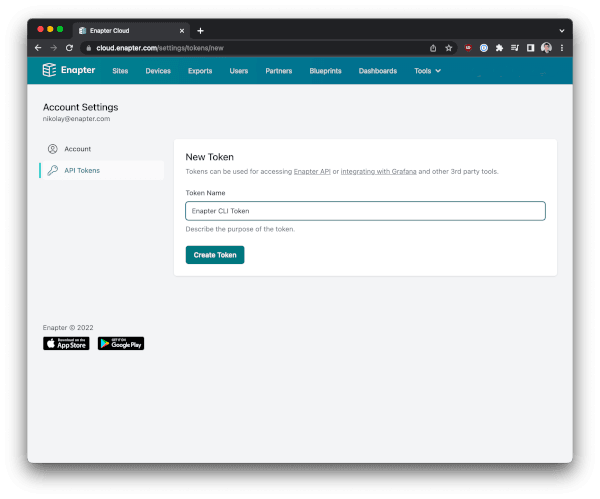
Enter your Token name and click Create Token button
Please note that if you don't save your token, it is not possible to reveal it anymore. You need to generate a new token.
To get the logs from UCM you need to know your UCM ID. You can find it either on the About screen in the mobile application (click on UCM ID to copy), or on the device screen in Enapter Cloud (click on the ID to copy).
Pass your API token(via environment variable) and UCM hardware ID to enapter CLI command.
export ENAPTER_API_TOKEN=<YOUR API TOKEN>
enapter devices logs --hardware-id <UCM ID>
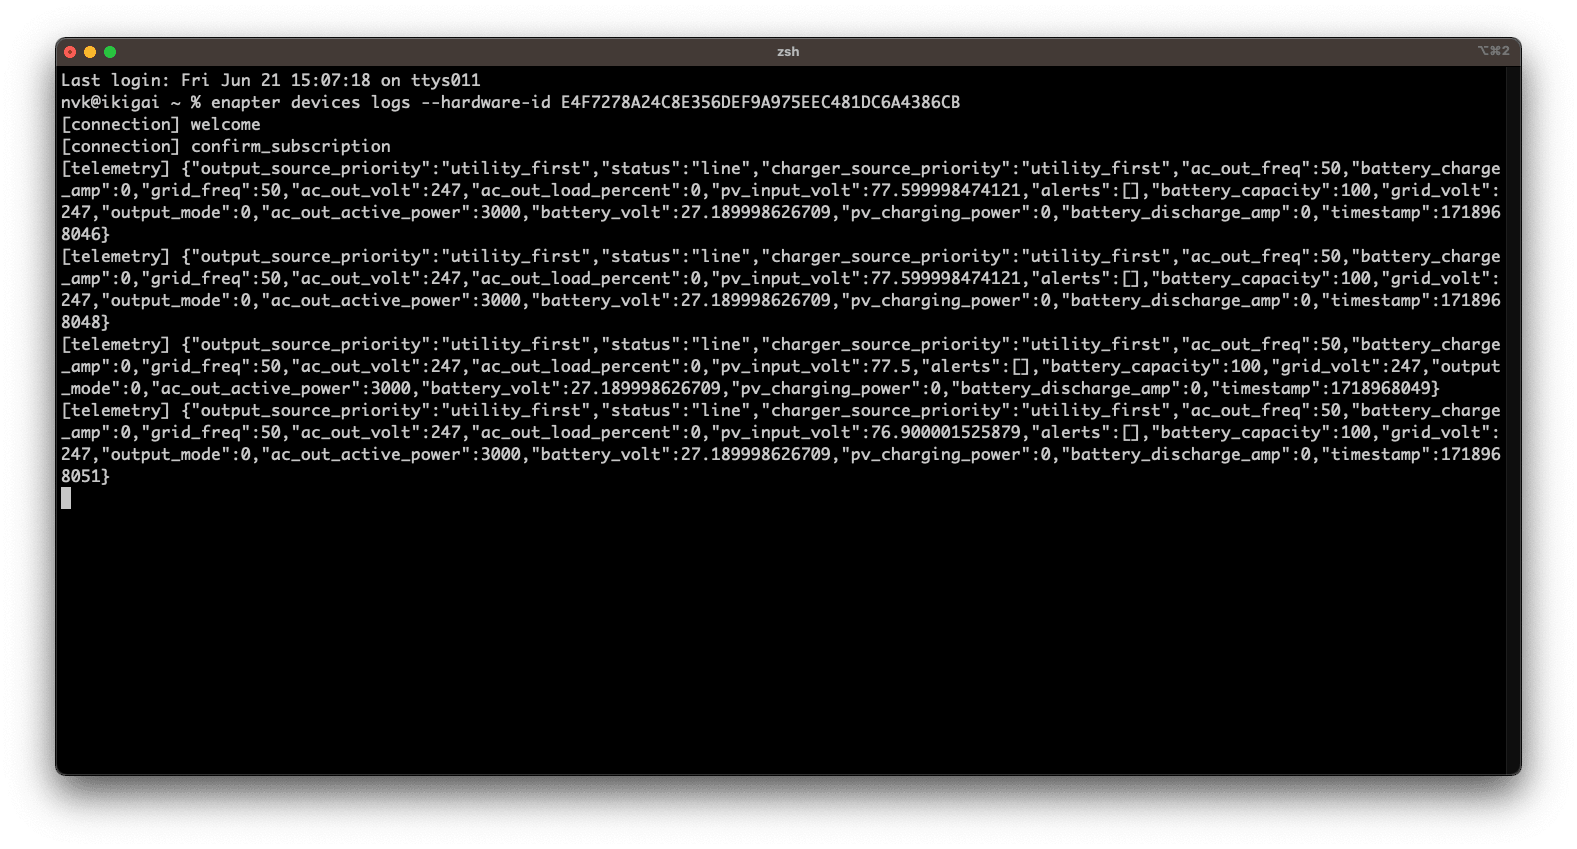
Logs will show up in terminal window in few seconds